ART-PRESENTATION: Gerhard Richter-Colour Charts
 Most famous and important artists have a signature style. But Gerhard’s Richter work is surprisingly various. Glenn Lowry, the director of the Museum of Modern Art, New York, noted that “Richter is the author of pictures so different from one another that at first glance they seem to be by different hands”.
By Efi Michalarou
Photo: Dominique Levy Gallery Archive
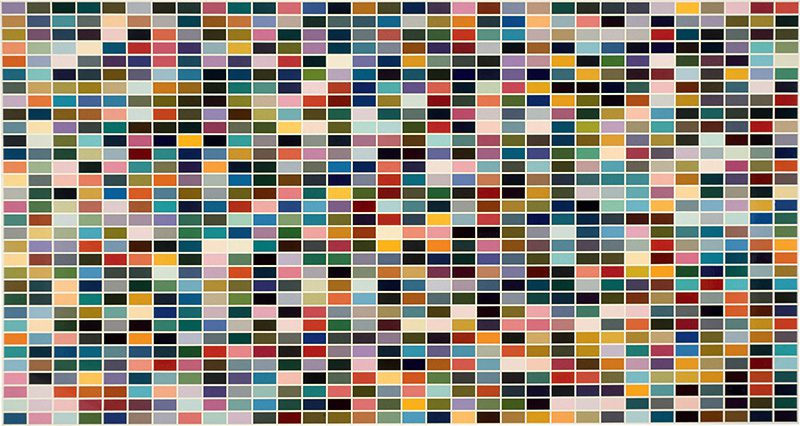
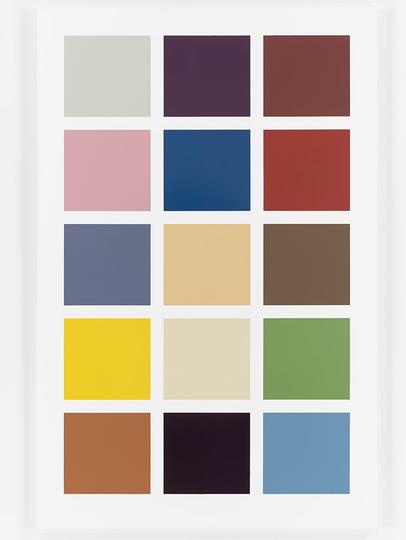
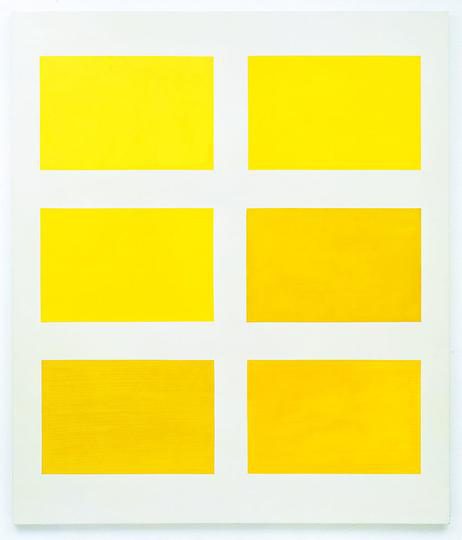
As early as 1966, one of the pioneers of the New European Painting, Gerhard Richter during a visit to a Düsseldorf hardware store noticed an array of paint sample cards. He created paintings based on colour charts, using the rectangles of colour as found objects in an apparently limitless variety of hue. Conceived during a period of intensive experimentation, the Colour Charts mark a radical stylistic shift in the artist’s practice, which had previously consisted of Black & White Photo Paintings. The Colour Charts have been recognised as seminal in the artist’s oeuvre, as they set the stage for his renowned multicoloured Abstract Paintings of the 1970s and beyond. Richter has repeatedly indicated his belief that the dichotomy between figuration and abstraction is essentially a fallacy, and his expression of the same ideas through vastly different styles throughout his career corroborates this assertion. The Colour Charts are the first paintings in Richter’s career in which colour appears, with the exception of “Ema (Nude on a Staircase)”. As he told to Irmeline Lebeer in an interview in 1973 “The first colour charts were unsystematic. They were based directly on commercial colour samples. They were still related to Pop Art. In the canvases that followed, the colours were chosen arbitrarily and drawn by chance. Then, 180 tones were mixed according to a given system and drawn by chance to make four variations of 180 tones. But after that the number 180 seemed too arbitrary to me, so I developed a system based on a number of rigorously defined tones and proportions”. The exhibition “Gerhard Richter: Colour Charts” is featuring a vital group of paintings selected from the artist’s original 19 Colour Charts produced in 1966. The exhibition focuses on the earliest works of this series since their inaugural appearance at Galerie Friedrich & Dahlem in Munich in 1966. The exhibition also includes a group of Colour Charts painted in 1971, when Richter reexamined and expanded the series after a five-year hiatus. Like the monumental “180 Farben”, a work provided by the Gerhard Richter Archive in Dresden. Comprised of twenty panels, each with a three-by-three grid, this is the first painting Richter produced when he returned to the Colour Charts in 1971. In addition to works from these years, in the exhibition is presented a collection of archival documents related to the series, including an original 1960s Ducolux sample card for enamel paint.
Info: Gerhard Richter: Colour Charts, Dominique Levy Gallery, 22 Old Bond Street, London, Duration: 13/10/15-16/1/16, Tue-Sat 10:00-18:00, www.dominique-levy.com


